
At a glance
Sierra ChartTime windows per day, each with its own profile
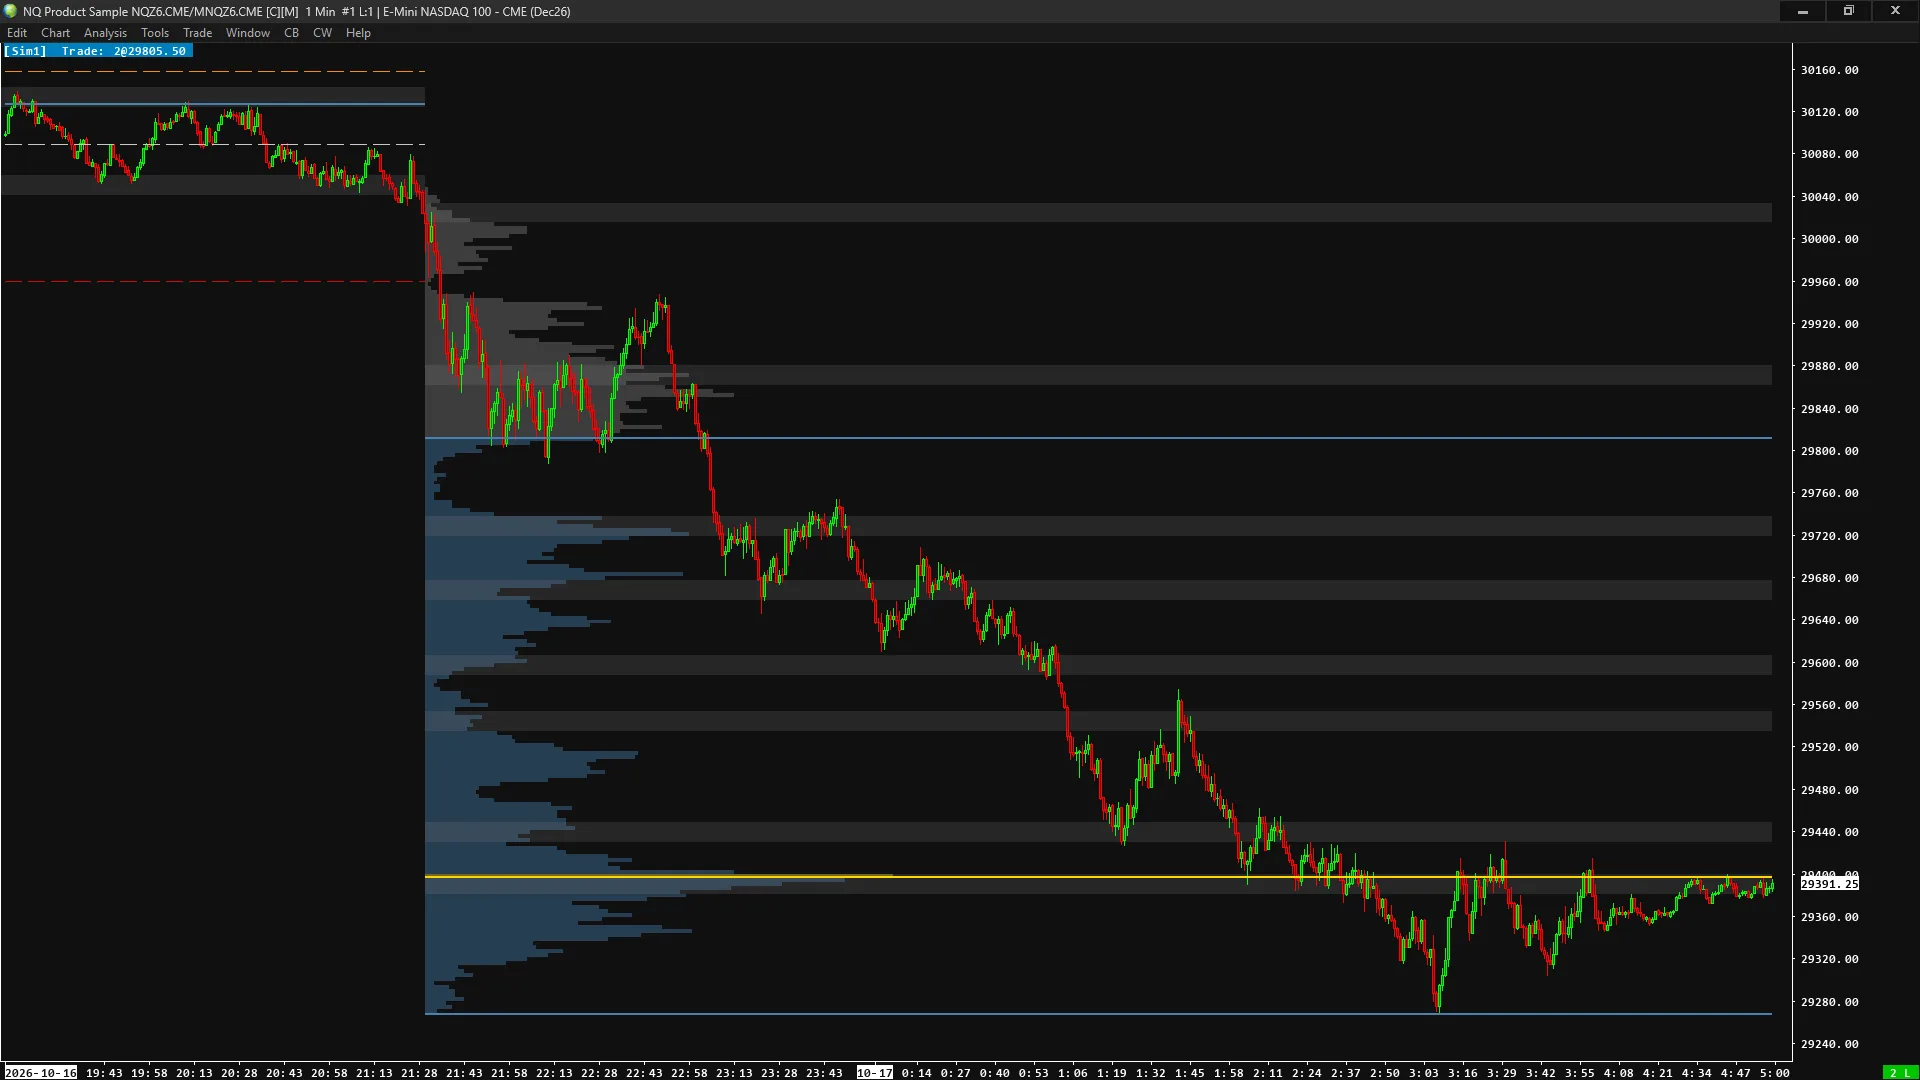
VAH, VAL, POC and the previous day’s high, low, open and close
Once per Sierra Chart username
One payment, every update included
One or two profiles a day
From the time windows you set, for example the morning and the afternoon, or the overnight and the day session. Value area and POC rows get their own colours.
VAH, VAL and POC lines
For each profile, running on into the next profile or the next day, or ending with their own session.
Previous-day levels
High, low, open and close of each day, from their own session window. Each line can be turned off.
Volume node zones
High volume nodes, where price spent time, and low volume nodes, where it moved through quickly, drawn as transparent zones. By default a zone appears only after price came back to it and moved away.
Touch values for alerts
Whether a bar’s high or low touched a zone and held on its side, with a count of how often that zone has been touched. They never use future bars.
Your colours and styles
Line colour, width and style come from the study’s Subgraphs tab; histogram width, colours and transparency are inputs.
Enter your Sierra Chart username
At checkout, or in the free trial box. It’s in Sierra Chart under Help >> About, “Account Name/Username”.
Restart Sierra Chart
File >> Exit, then start it again. Sierra Chart downloads the study when it starts; until then it won’t run.
Add the study
Analysis >> Studies >> Add Custom Study >> Parallax Volume Profile Suite.
How you get it
Parallax Volume Profile Suite is enabled for the Sierra Chart username you enter at checkout or in the free trial box: there is no key to type into Sierra Chart. Restart Sierra Chart after buying or starting a trial. Typed the username wrong? Change it at parallaxchart.com/studies/username with the licence key from your receipt.
Payment is handled by our payment service, which acts as the seller of record. See the terms and refund policy.
Specifications
All three studies, one purchase
Volume Profile Suite · RSI Divergence · Chart Navigator. Bought separately they cost $104. One payment, every update included.
Pair it with the journal
The Parallax Trading Journal records every Sierra Chart trade, and any paid plan includes Parallax Chart Navigator.