
What Is an R Multiple in Trading? How to Calculate R
Short answer: R is the amount you risk on a trade: the distance from your entry to your stop, in money. An R multiple is a trade’s result divided by that risk. A trade that made twice what it risked is +2R; a full stop-out is −1R. Counting in R lets you compare trades of different sizes, markets and stops on one scale.
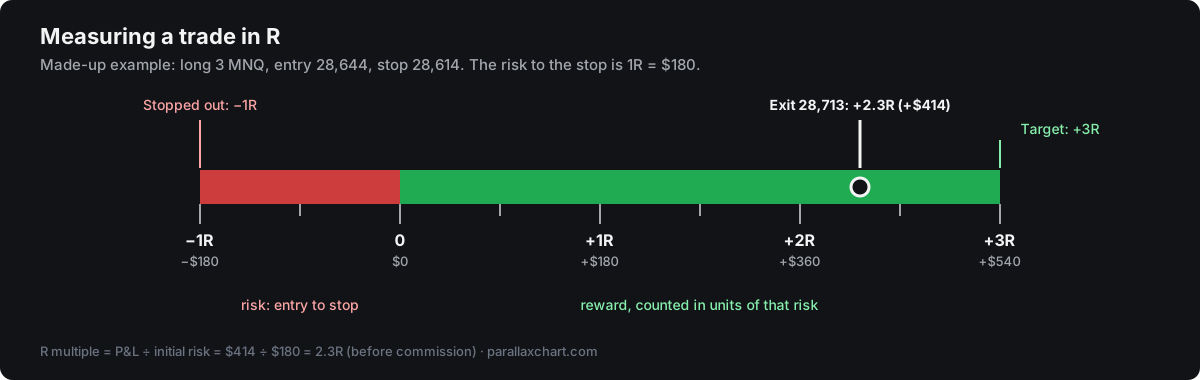
How to calculate R
| Step | Formula | Example (long 3 MNQ) |
|---|---|---|
| 1. Risk in points | Entry − stop (short: stop − entry) | 28,644 − 28,614 = 30 points |
| 2. Risk in money = 1R | Points × contracts × $ per point | 30 × 3 × $2 = $180 |
| 3. Result in money | (Exit − entry) × contracts × $ per point | (28,713 − 28,644) × 3 × $2 = $414 |
| 4. R multiple | Result ÷ 1R | $414 ÷ $180 = +2.3R |
Use the stop you placed when you entered (the initial risk), even if you moved it later. Otherwise R stops meaning the same thing from trade to trade.
The same trade in points, dollars and R
| Outcome | Points | Dollars | R |
|---|---|---|---|
| Stopped out | −30 | −$180 | −1R |
| Exit at break-even | 0 | $0 | 0R |
| Exit at 28,713 | +69 | +$414 | +2.3R |
| Target hit at 28,734 | +90 | +$540 | +3R |
Change the size to 6 contracts and every dollar figure doubles, but the R column stays the same. That’s why R is useful for comparing trades.
Average R and expectancy
Average R (also called expectancy in R) is the mean R multiple across your trades: add up the R of every trade and divide by the number of trades.
| Trades | Wins | Average win | Losses | Average loss | Average R |
|---|---|---|---|---|---|
| Example A | 4 of 10 | +2.0R | 6 of 10 | −1.0R | (4 × 2 − 6 × 1) ÷ 10 = +0.2R |
| Example B | 6 of 10 | +0.8R | 4 of 10 | −1.0R | (6 × 0.8 − 4 × 1) ÷ 10 = +0.08R |
| Example C | 5 of 10 | +1.0R | 5 of 10 | −1.2R | (5 × 1 − 5 × 1.2) ÷ 10 = −0.1R |
Example A wins less often than B but has the higher average R. Win rate alone doesn’t tell the whole story.
The win rate you need to break even
If your average win and average loss stay the same, this is the win rate at which your results come out at 0R (before commission):
| Average win ÷ average loss | Break-even win rate |
|---|---|
| 0.5 to 1 | 66.7% |
| 1 to 1 | 50.0% |
| 1.5 to 1 | 40.0% |
| 2 to 1 | 33.3% |
| 3 to 1 | 25.0% |
Formula: break-even win rate = 1 ÷ (1 + average win ÷ average loss). Commission and slippage move the real figure up a little.
Tracking R in your journal
- Write the stop down at entry, every time. No stop, no R.
- Use the initial stop, not where it ended up.
- Review in R as well as dollars, especially when your size changes.
- Look at R by setup and session, not only overall.
Our free trading journal template works out R for every trade and shows your average R and how your trades spread across R. Parallax Trading Journal shows R for every trade imported from Sierra Chart, along with MAE and MFE in R (What Are MAE and MFE?), and has a 7-day free trial. See the journal.
Frequently asked
What does 1R mean in trading?
1R is the amount you risk on a trade: the distance from entry to stop, times your size and the value of a point.
Can an R multiple be more than −1R?
Yes, a loss can be bigger than −1R if the market gaps past your stop or the fill slips, or if you trade without the stop you planned.
Is a higher average R always better?
A higher average R means more per trade relative to risk, but it says nothing about how often you trade or how big the swings are. Look at it alongside the number of trades and the drawdown.
Do I count commission in R?
Many traders work R out on the net result after commission, so it matches their real P&L. Pick one way and use it every time.